
The economics of U.S. natural gas production vary widely by region. While Henry Hub prices often dominate the headlines, what really drives supply is whether producers can cover their breakeven costs. These costs serve as a barometer for activity in each basin, signaling when drilling accelerates and when production slows.
What is Breakeven Cost
A breakeven cost represents the estimated natural gas or oil price required for a well or project to earn an acceptable rate of return, typically around 10 percent, after accounting for drilling, completion, operating, and transportation costs. In other words, it is the price level at which producers can cover their full costs and sustain production without losing money.
Why Breakeven Costs Differ
Breakeven costs are not fixed. They shift with geology, technology, and market conditions. Some formations, like the core of Appalachia’s Marcellus and Utica, produce some of the lowest-cost gas in the world because of highly productive rock. By contrast, the Haynesville requires deeper, high-pressure wells that are more expensive to drill. Technology also matters: operators that consistently use longer laterals and advanced completions bring costs down further. Revenue and infrastructure add another layer. Wells that produce natural gas liquids (NGLs) benefit from an additional revenue stream, while pipeline bottlenecks or steep basis discounts can erode margins.
For clarity, dry gas wells produce almost entirely methane, which ties their economics closely to Henry Hub prices. Liquids-rich gas wells also yield propane, butane, and other liquids that provide extra value and reduce the effective breakeven.
Breakeven by Region
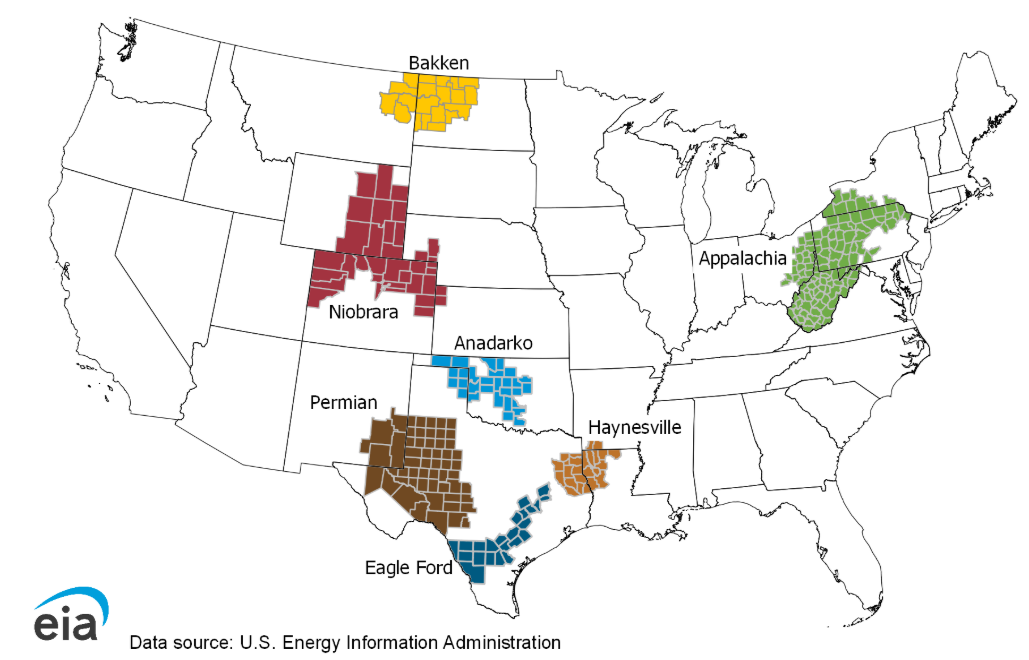
- Appalachia (Marcellus & Utica): $1.75–$2.50 per MMBtu. This is the lowest-cost region in the U.S. and among the most competitive globally, supported by prolific dry gas production and strong midstream infrastructure.
- Haynesville (Louisiana & Texas): $3.75–$4.25 per MMBtu. Costs are higher due to deep, high-pressure wells, but proximity to Gulf Coast LNG export demand provides a strategic advantage.
- Anadarko (Oklahoma/Texas Panhandle): Produces a mix of dry and liquids-rich gas. Dry gas is generally uneconomic below ~$2.50 per MMBtu, though NGL uplift can improve returns in richer zones.
- Eagle Ford (South Texas): Produces both dry and liquids-rich gas. Breakeven costs for dry gas typically range from $2.75 to $3.50 per MMBtu, but returns improve in wet gas areas where NGL volumes provide additional value.
- Niobrara (Colorado & Wyoming): Primarily oil-driven, with associated gas linked to ~$55–$60 WTI. Economics are shaped by local infrastructure, takeaway capacity, and regulatory conditions.
- Permian Basin (West Texas): Gas production is tied to oil drilling activity. As long as oil prices stay above $50 WTI, gas output continues regardless of Henry Hub prices, since it is produced as a by-product.
- Bakken (N. Dakota): Higher than Permian, gas is a by-product of oil production, with economics tied to ~$55 WTI. Output is limited by takeaway constraints and flaring regulations.
Why Producers Curtail Production
When prices fall below breakeven levels, producers often cut back drilling or shut in existing wells. At prices under $2.00 per MMBtu, many dry gas wells in Appalachia become uneconomic, while above $4.00 the Haynesville becomes competitive and activity picks up.
Yet breakeven costs are only part of the equation. Producers today are far more focused on capital discipline. The old model of growth at all costs has given way to an emphasis on shareholder returns, free cash flow, and balance sheet strength. Even when wells are technically profitable, companies may choose to hold back activity to preserve cash, protect dividends, and avoid oversupplying the market. Curtailments therefore serve both economic and strategic purposes.
Why You Should Care
Breakeven levels are more than cost estimates. They are the supply switch for U.S. natural gas and a signal of how producers balance geology, economics, and financial discipline. By watching where prices sit relative to these thresholds, we gain early insight into whether production will expand or slow.
At Stanwich Energy, we monitor these levels closely to guide supply outlooks and risk management strategies for clients navigating a volatile market.
For additional information please contact us to schedule a quick call.